```{r}
#| label: fig-regression
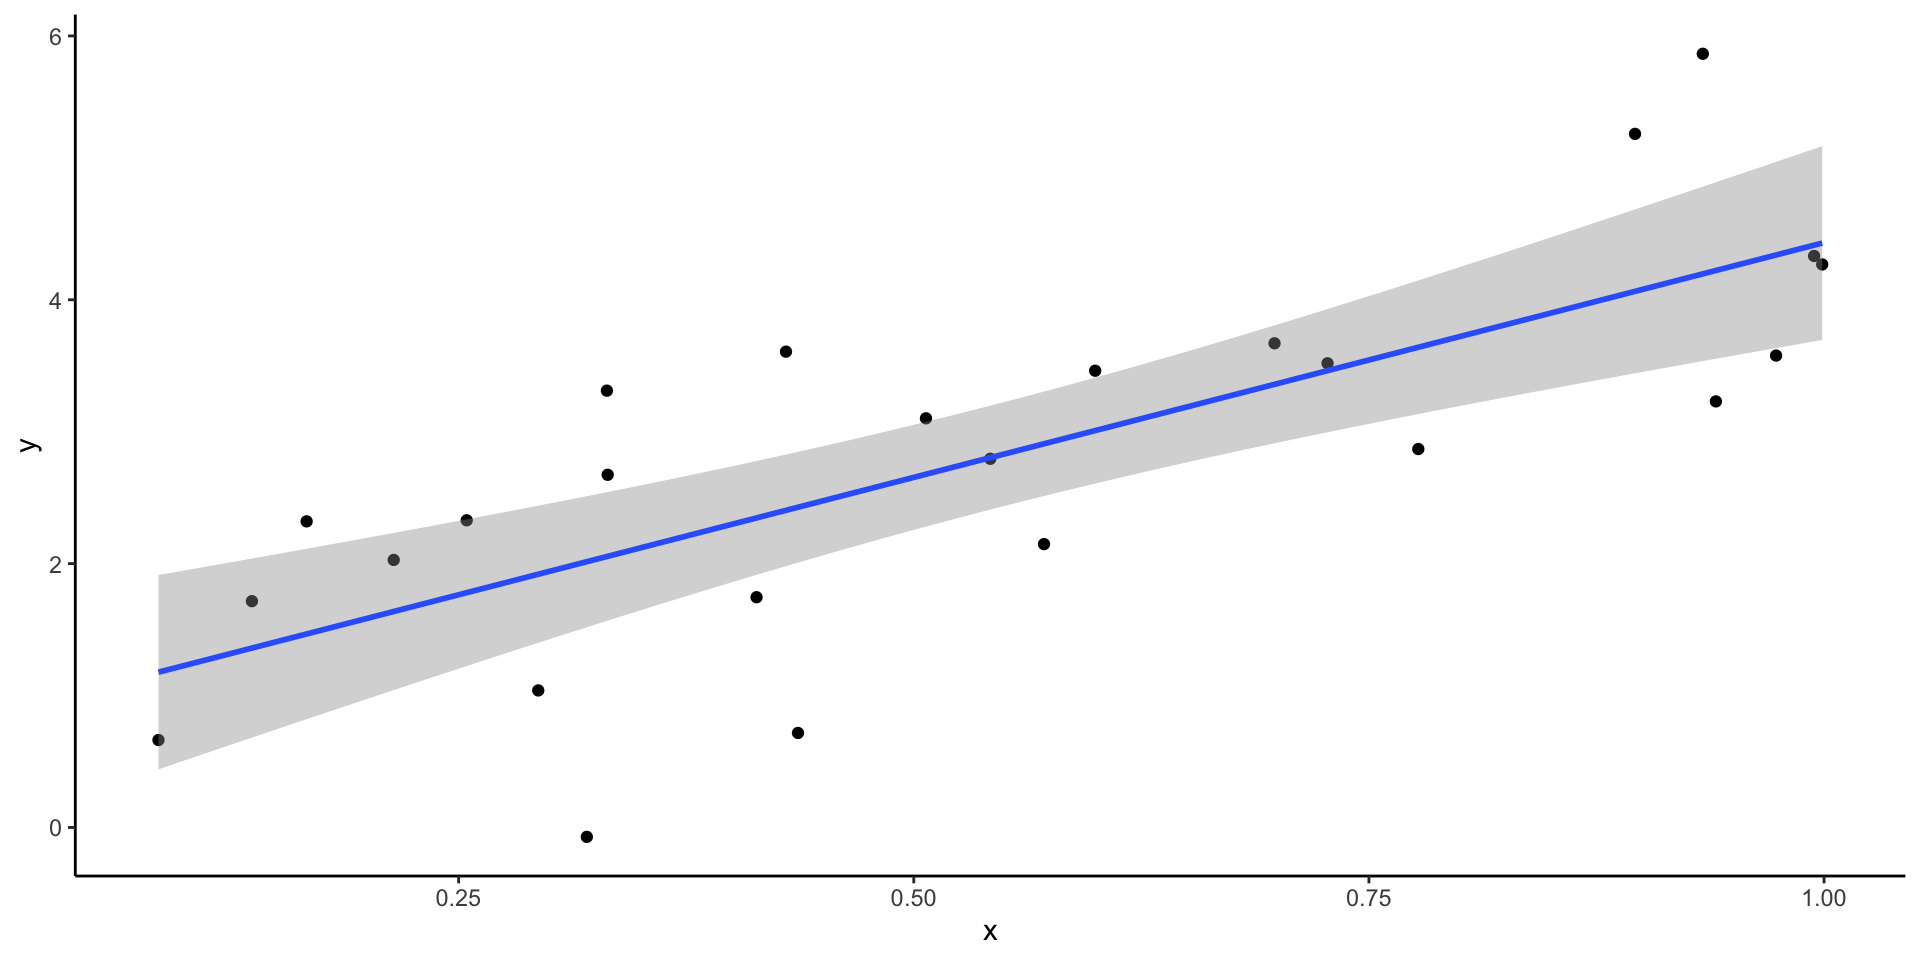
#| fig-cap: y is correlated with x, isn't that swell?

set.seed(1057)
dat <- tibble(
  x = runif(25),
  y = 3 * x + 1 + rnorm(25)
)
ggplot(dat, aes(x, y)) +
  geom_point() +
  geom_smooth(method = "lm", formula = y ~ x) +
  theme_classic()
```

